
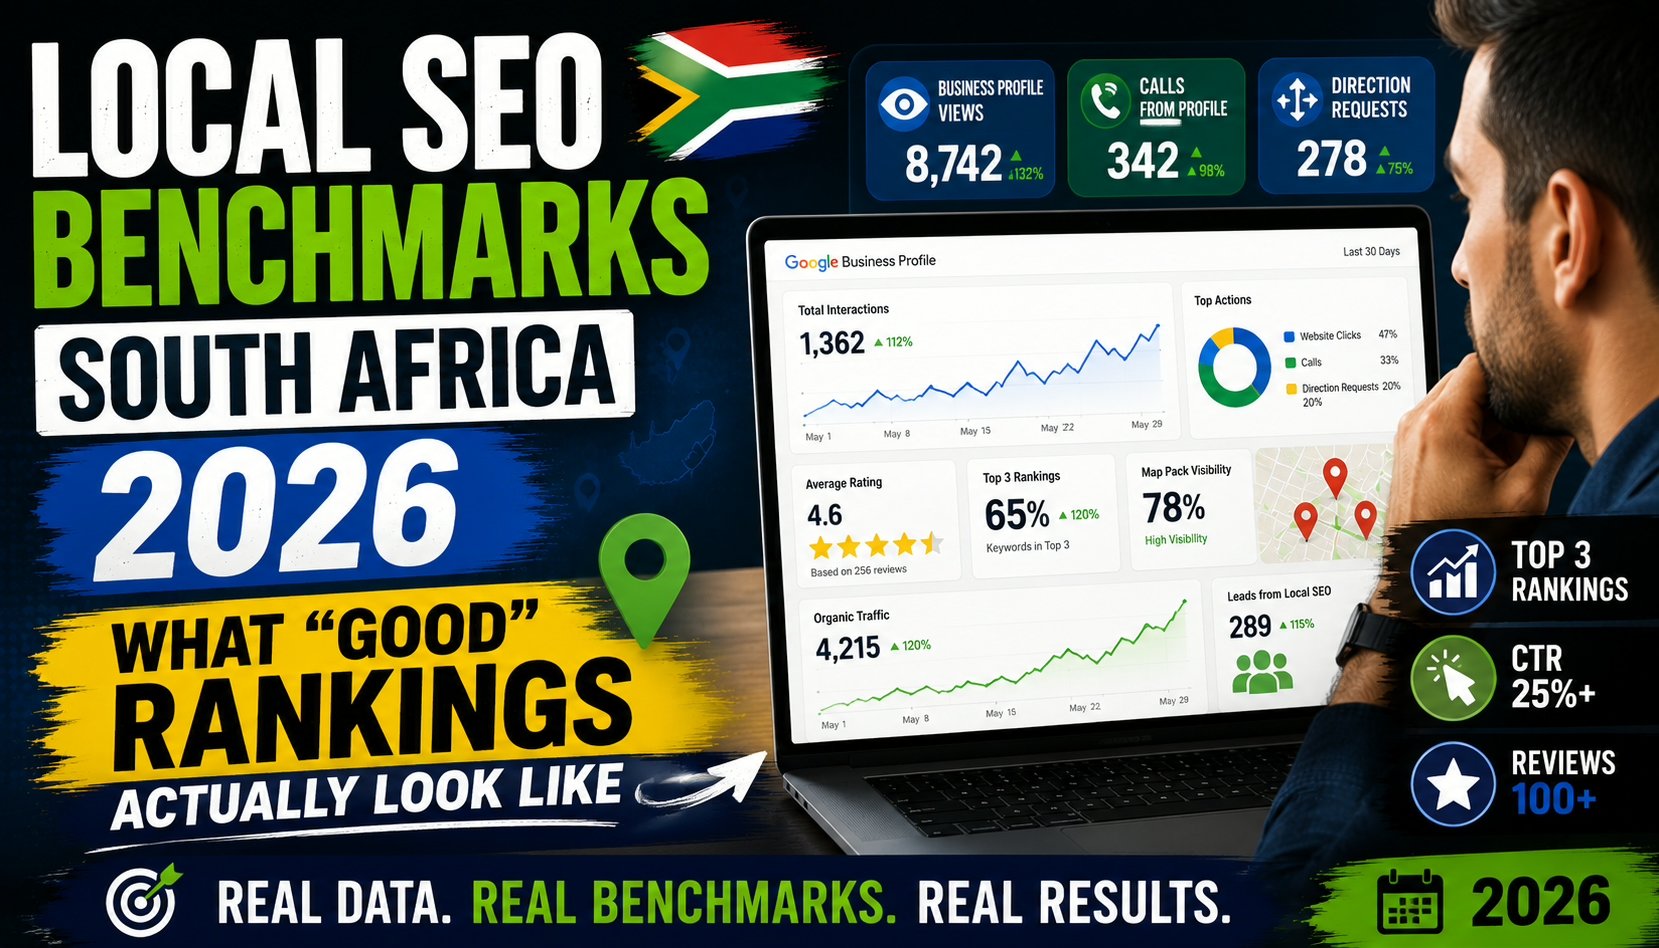
Local SEO Benchmarks in South Africa: What “Good Rankings” Actually Look Like in 2026
Most South African businesses don’t know if their SEO is actually working. They see impressions in Google Business Profile, occasional clicks, maybe a few calls—but there’s no clear benchmark to answer the only question that matters:
“Is this performance good—or are we underperforming?”
If you’re ranking but not generating consistent leads, you don’t have a visibility problem—you have a benchmark problem. Without context, data is meaningless.
This guide defines local SEO benchmarks in South Africa for 2026—covering rankings, traffic, click-through rates, conversions, and timelines—so you can measure performance against realistic standards, not assumptions.
⸻
What “Good” Local SEO Actually Means in 2026
A common mistake is equating rankings with success.
The Reality:
- Ranking #1 ≠ more leads (automatically)
- Traffic ≠ conversions
- Visibility ≠ revenue
What “good” actually means:
A strong local SEO campaign delivers:
- Consistent Map Pack visibility
- High-intent traffic
- Measurable lead generation
- Declining cost per acquisition over time
👉 Benchmarking must focus on outcomes, not vanity metrics
⸻
Google Business Profile Benchmarks (South Africa)
Your Google Business Profile (GBP) is the primary driver of local visibility, especially for service-based businesses.
Monthly Views Benchmarks
| Business Type | Monthly Views |
| Small town business | 500 – 2,000 |
| Urban SME | 2,000 – 10,000 |
| High-competition niche | 10,000 – 50,000+ |
⸻
Click-Through Actions (Monthly)
| Action | Benchmark |
| Website clicks | 2% – 8% of views |
| Calls | 1% – 5% of views |
| Direction requests | 1% – 3% |
⸻
Review Benchmarks
| Market Type | Review Count |
| Small towns | 20 – 100 reviews |
| Cities | 100 – 500+ reviews |
| Competitive niches | 500 – 2,000+ |
⸻
Rating Benchmark:
- Minimum competitive rating: 4.3+ stars
- Ideal: 4.5 – 4.8
⸻
👉 Insight:
In South Africa, review velocity (new reviews per month) often matters more than total volume.
⸻
Local Search Ranking Benchmarks
Map Pack vs Organic Rankings
There are two critical ranking zones:
1. Map Pack (Top 3 Listings)
- Generates 60%–80% of local clicks
- High conversion intent
2. Organic Results
- Supports authority and broader keyword coverage
⸻
Target Benchmarks:
| Position | Impact |
| Map Pack Top 3 | High lead generation |
| Organic Top 3 | Strong support traffic |
| Page 2+ | Minimal value |
⸻
👉 Key takeaway:
If you’re not in the Map Pack, your local SEO is underperforming.
⸻
Click-Through Rate (CTR) Benchmarks
Organic Search CTR
| Position | CTR Range |
| #1 | 20% – 35% |
| #2–3 | 10% – 20% |
| #4–10 | 2% – 10% |
⸻
Map Pack CTR
- Typically higher than organic due to:
- Proximity
- Reviews
- Mobile behaviour
Estimated:
- Top 3 listings: 15% – 30% combined CTR
⸻
👉 Insight:
Improving your position from #3 to #1 can double your traffic—without increasing rankings volume.
⸻
Traffic Benchmarks for Local SEO
Monthly Organic Traffic Expectations
| Business Type | Monthly Traffic |
| Small local business | 200 – 1,000 |
| Growing SME | 1,000 – 5,000 |
| Competitive market | 5,000 – 20,000+ |
⸻
Important Context:
- South African keyword volumes are lower than global markets
- Local intent keywords drive higher conversion rates
👉 Quality > Quantity
⸻
Conversion Benchmarks (The Metric That Actually Matters)
Traffic without conversion is wasted opportunity.
Website Conversion Rates
| Industry | Conversion Rate |
| Service businesses | 3% – 10% |
| High-trust niches (legal, medical) | 5% – 15% |
| eCommerce (local intent) | 1% – 3% |
⸻
Google Business Profile Conversion
- Calls convert significantly higher than forms
- Estimated:
- Call conversion rate: 20% – 60%
- Website lead conversion: 3% – 10%
⸻
👉 Critical insight:
Optimising for calls and direct actions often outperforms website traffic alone.
⸻
Timeline Benchmarks: How Long Local SEO Should Take
Realistic Timeline:
| Phase | Timeline | Outcome |
| Setup | Month 1–3 | Technical + profile optimisation |
| Movement | Month 3–6 | Ranking improvements |
| Growth | Month 6–12 | Traffic + leads increase |
⸻
👉 If you see no movement after 6 months, something is wrong.
⸻
Industry-Specific Benchmarks in South Africa
Legal Services
- High CPC, high competition
- Requires:
- Strong backlinks
- High review volume
⸻
Home Services (Plumbing, Security, etc.)
- Strong Map Pack dependency
- High call conversion rates
⸻
Medical Practices
- Trust-driven
- Reviews + authority critical
⸻
Tourism & Hospitality
- Seasonal traffic
- Strong reliance on reviews + images
⸻
eCommerce (Local Intent)
- SEO supports product discovery
- Requires strong category optimisation
⸻
The Biggest Local SEO Misconceptions
❌ “Ranking is all that matters”
Ranking without conversion is meaningless.
⸻
❌ “More traffic = better performance”
Low-quality traffic reduces ROI.
⸻
❌ “Reviews alone drive rankings”
Reviews matter—but so do:
- Proximity
- Relevance
- Website authority
⸻
❌ “SEO is a one-time setup”
SEO is ongoing optimisation—not a once-off task.
⸻
How to Benchmark Your Own SEO Performance
Step 1: Track the Right Metrics
- Rankings (Map Pack + organic)
- Traffic
- Conversions
- Cost per lead
⸻
Step 2: Use the Right Tools
- Google Analytics
- Google Search Console
- Google Business Profile Insights
⸻
Step 3: Compare Against Benchmarks
Ask:
- Are we within expected ranges?
- Are we improving month-to-month?
⸻
Step 4: Identify Gaps
- Low traffic → keyword issue
- Low conversions → website issue
- Low visibility → authority issue
⸻
FAQ: Local SEO Benchmarks South Africa
What is a good Google ranking in South Africa?
Top 3 in the Map Pack and top 3 organic results for key terms.
⸻
How many reviews do I need to rank locally?
Depends on competition—but typically:
- 50+ for small markets
- 200+ for cities
⸻
How long does local SEO take in South Africa?
Typically 3–6 months for traction and 6–12 months for strong results.
⸻
What is a good conversion rate for local SEO?
- Website: 3% – 10%
- Calls: significantly higher
⸻
Why am I ranking but not getting leads?
Likely causes:
- Poor click-through rate
- Weak offer
- Low trust signals
⸻
The Real Benchmark: ROI, Not Rankings
Here’s the uncomfortable truth:
You can hit every benchmark in this article—and still fail—if your SEO doesn’t generate revenue.
The real benchmark is:
- Cost per lead
- Cost per acquisition
- Return on investment
Everything else is secondary.
⸻
Want to Know How Your SEO Actually Performs?
If you’re unsure whether your SEO is:
- Underperforming
- Average
- Or ahead of competitors
Then you need a proper benchmark analysis—not guesswork.
A data-driven audit will show:
- Where you stand
- Where you’re losing leads
- What to fix first
Because in 2026, the businesses that win local search aren’t the ones with the most traffic…
They’re the ones with the best-performing systems.


