
Local SEO Benchmarks in South Africa: What “Good Rankings” Actually Look Like in 2026
Introduction: How Do You Know If Your Local SEO Is Actually Working?
How do you know if your local SEO is delivering real results — or just vanity metrics?
Many South African businesses are told their SEO is “working” because rankings improved or traffic increased. But without clear benchmarks, it’s impossible to determine whether performance is actually strong, average, or underperforming.
In 2026, local SEO is no longer about simply appearing in search results. It’s about measurable visibility, consistent lead generation, and competitive dominance within your service area.
This guide provides realistic local SEO benchmarks for South Africa, giving you a clear framework to evaluate performance across rankings, traffic, conversions, and visibility.
What is Local SEO Performance?
Local SEO performance should be measured across four key areas:
Rankings
- Google Map Pack (Top 3 local results)
- Organic search rankings (Page 1 vs Page 2+)
Traffic
- Visitors from local intent searches
- Growth in organic sessions over time
Conversions
- Calls
- Form submissions
- Direction requests
Visibility
- Google Business Profile impressions
- Search appearance frequency
True performance is not just about ranking — it’s about turning visibility into measurable business outcomes.
Google Maps (Map Pack) Benchmarks
The Map Pack is one of the most valuable positions in local SEO.
Ranking Position Benchmarks
- Positions 1–3: High visibility, majority of clicks
- Positions 4–10: Minimal visibility, low traffic impact
If your business is not consistently in the top 3, your local SEO is underperforming.
Click-Through Rate (CTR) Benchmarks
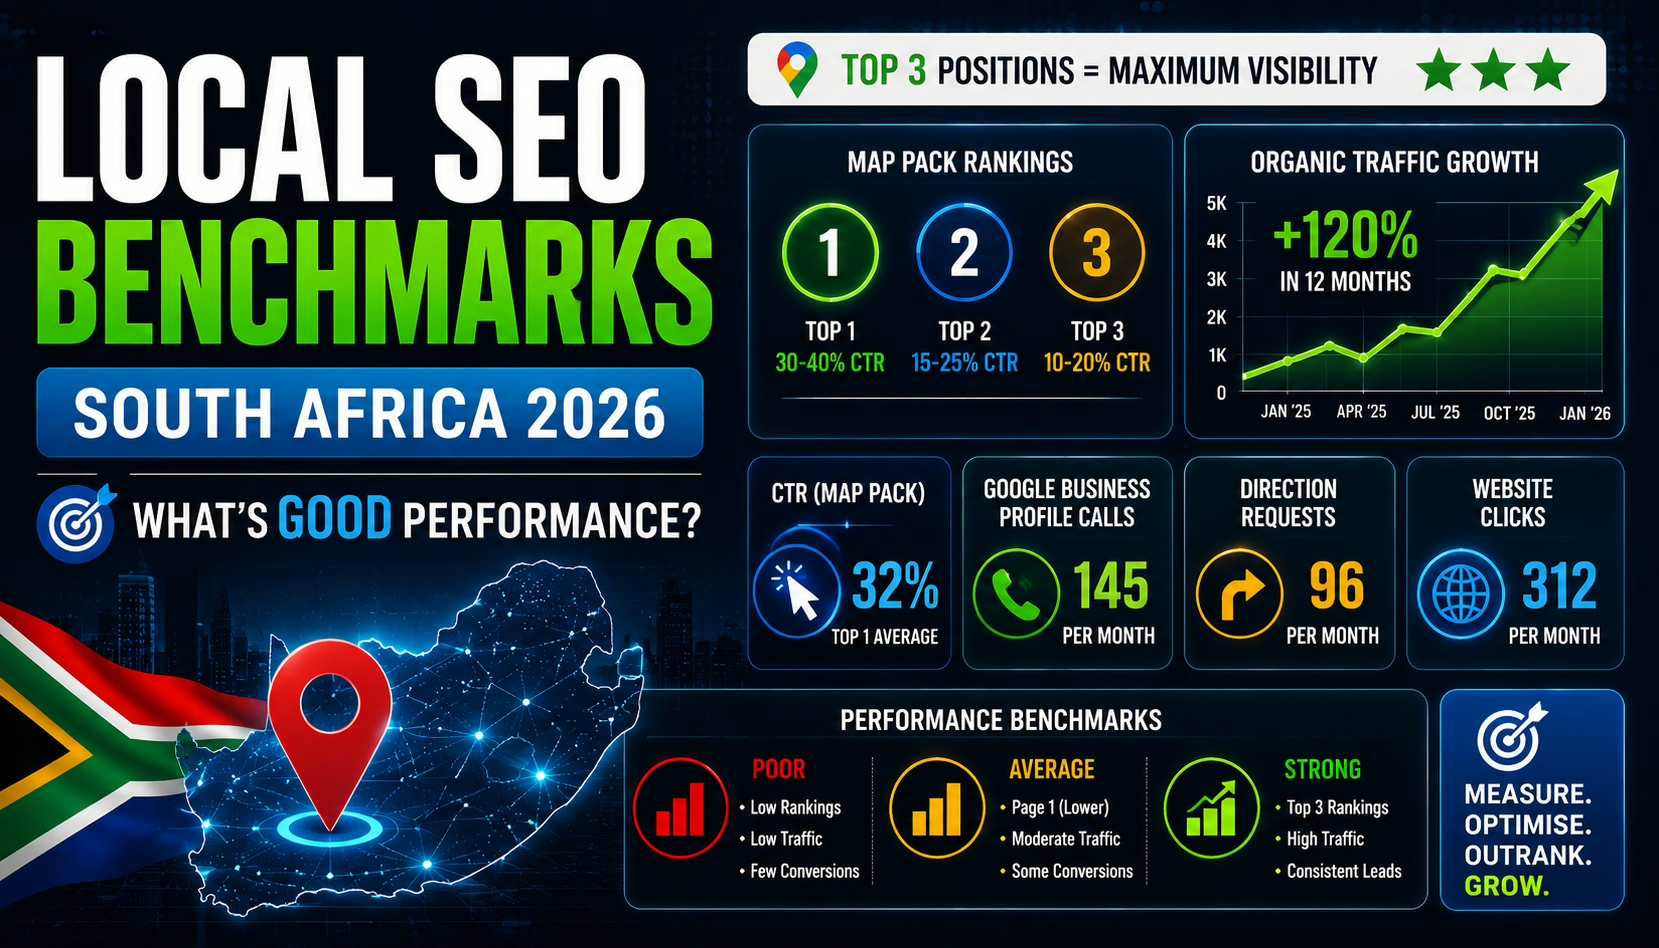
Estimated CTR for Map Pack:
- Position 1: 30% – 40%
- Position 2: 15% – 25%
- Position 3: 10% – 20%
Lower positions receive significantly fewer clicks.
Visibility Radius Benchmarks
This measures how far from your location your business ranks.
- Weak: 1–3 km radius
- متوسط: 5–10 km radius
- Strong: 10–25+ km radius (depending on industry)
A strong local SEO strategy expands your ranking footprint beyond your immediate area.
Google Business Profile Benchmarks
Your Google Business Profile is a primary driver of local SEO performance.
Monthly Performance Benchmarks
Impressions
- Low: < 1,000/month
- Average: 1,000 – 5,000/month
- Strong: 5,000 – 20,000+/month
Website Clicks
- Low: < 50/month
- Average: 50 – 200/month
- Strong: 200 – 1,000+/month
Calls
- Low: < 20/month
- Average: 20 – 100/month
- Strong: 100 – 500+/month
Direction Requests
- Low: < 20/month
- Average: 20 – 80/month
- Strong: 80 – 300+/month
Review Benchmarks
- Poor: < 20 reviews
- Average: 20 – 100 reviews
- Strong: 100+ reviews with consistent growth
Rating benchmark:
- Minimum target: 4.3+ stars
- Strong performance: 4.5–4.8 stars
Local Organic Rankings Benchmarks
Ranking in organic search results remains critical.
Position Benchmarks
- Positions 1–3: High traffic and authority
- Positions 4–10: Moderate traffic
- Page 2+: Minimal visibility
Traffic Expectations by Ranking
- Position 1: 25% – 35% CTR
- Position 3: 10% – 15% CTR
- Position 10: 2% – 5% CTR
Keyword Coverage Benchmarks
- Weak: < 10 ranking keywords
- Average: 10 – 50 keywords
- Strong: 50 – 200+ keywords
High-performing businesses rank for a wide range of related local keywords.
Website Performance Benchmarks
Organic Traffic Benchmarks
For local businesses:
- Low: < 500 visitors/month
- Average: 500 – 2,000/month
- Strong: 2,000 – 10,000+/month
Conversion Rate Benchmarks
- Poor: < 1%
- Average: 1% – 3%
- Strong: 3% – 8%+
Engagement Metrics
Bounce Rate
- Poor: > 70%
- Average: 50% – 70%
- Strong: < 50%
Average Session Duration
- Weak: < 1 minute
- Average: 1–2 minutes
- Strong: 2–4+ minutes
Local SEO Authority Benchmarks
Backlink Profile
- Weak: < 10 referring domains
- Average: 10 – 50 domains
- Strong: 50 – 200+ relevant domains
Domain Authority (Relative Benchmark)
- Low: DA < 10
- متوسط: DA 10 – 30
- Strong: DA 30+
Citation Consistency
- Poor: Inconsistent NAP data
- Average: Partially consistent listings
- Strong: Fully consistent across all platforms
Timeline Benchmarks
0–3 Months
- Technical fixes
- Google Business Profile optimisation
- Initial content improvements
Minimal ranking movement expected.
3–6 Months
- Ranking improvements
- Increased visibility
- Early traffic growth
6–12 Months
- Strong ranking positions
- Consistent traffic
- Lead generation growth
SEO compounds over time — results accelerate after the initial phase.
What “Good SEO” Actually Looks Like
| Metric | Poor | Average | Strong |
| Map Pack Ranking | Outside Top 5 | Top 5–3 | Top 3 consistently |
| Organic Rankings | Page 2+ | Page 1 (lower) | Top 3 positions |
| Monthly Traffic | < 500 | 500–2,000 | 2,000+ |
| Conversion Rate | < 1% | 1–3% | 3%+ |
| GBP Calls | < 20 | 20–100 | 100+ |
| Reviews | < 20 | 20–100 | 100+ |
Common Reasons Businesses Fall Below Benchmarks
- Weak or incomplete Google Business Profile
- No structured content strategy
- Poor technical SEO
- Lack of quality backlinks
- Inconsistent business information online
Most underperformance is structural, not competitive.
How to Improve Your Local SEO Performance
Step 1: Fix Your Technical Foundation
- Improve site speed
- Fix indexing issues
- Optimise mobile usability
Step 2: Optimise Your Google Business Profile
- Complete all fields
- Add services and descriptions
- Post regular updates
- Generate consistent reviews
Step 3: Build Content Authority
- Create location-based pages
- Develop blog content clusters
- Target local keywords
Step 4: Strengthen Your Backlink Profile
- Acquire local directory listings
- Build partnerships
- Secure relevant backlinks
Step 5: Track and Improve Performance
- Monitor rankings
- Analyse traffic
- Optimise underperforming pages
Conclusion: Benchmarking is the Key to SEO Success
Without benchmarks, SEO becomes guesswork.
Understanding what good performance actually looks like allows you to:
- Identify gaps
- Measure progress
- Make informed decisions
In 2026, the businesses that win in local SEO are those that track performance, optimise continuously, and execute strategically.
Ready to Evaluate Your SEO Performance?
If you’re unsure whether your SEO meets these benchmarks, the next step is clarity.
A professional SEO audit will show:
- Where you stand
- What’s underperforming
- What needs to be improved
Take action:
- Request a detailed SEO performance audit
- Identify missed opportunities
- Build a strategy that delivers measurable results
The difference between average and dominant local businesses is not effort — it’s execution.


